Calculating Home Solar ROI: The True Economics of Residential Solar in South Africa
For years, South African homeowners viewed residential solar installations primarily as an insurance policy against the disruption of load-shedding. Investing in a backup system was about maintaining basic operational continuity—keeping the lights on, the Wi-Fi active, and essential appliances running.
However, as the local energy landscape evolves, the financial framework has shifted. With escalating utility costs and restructuring municipal pricing models, residential solar has transitioned into a strategic capital investment.
But what is the actual, unembellished return on investment (ROI)? The answer isn’t a one-size-fits-all marketing statistic. A true calculation depends heavily on localized tariffs, consumption behavior, installation precision, and system lifecycle costs.
The Base Reality: Understanding South African Utility Dynamics
The primary financial driver for alternative energy adoption is the compounding velocity of traditional electricity tariffs. However, mapping your potential savings requires looking closely at how your specific municipality structures its billing.
Municipal pricing structures across South Africa vary significantly, and your baseline costs depend on whether you are on a prepaid or postpaid connection, or billed directly by Eskom.
In several major metros, structural overhauls have introduced or raised fixed monthly charges. For instance, single-phase postpaid users in certain areas can face fixed service, network, or capacity charges ranging anywhere from R500 to over R700 per month before consuming a single kilowatt-hour (kWh). Conversely, traditional prepaid structures often avoid these heavy fixed monthly blockades but utilize steep, stepped tariffs where the per-unit cost escalates aggressively the more electricity you use.
Understanding your specific municipal billing structure is step number one: it determines whether your solar setup is saving you money on high per-unit energy tiers or helping you offset rising fixed network costs.
System Profiles: Modern Sizing and Realistic Capital Outlays
To build an accurate payback model, we must establish realistic system profiles using modern hardware standards. Solar panels have advanced significantly; standard premium residential modules now commonly range between 550W and 600W+.
A robust hybrid configuration—which intelligently balances solar generation, lithium battery storage, and a calculated grid connection—typically scales across these three residential baselines:
| System Capacity (Inverter) | Photovoltaic (PV) Array Sizing | High-Performance Storage | Average Installed Cost Range | Typical Target Consumption |
| 5 kW Hybrid | 8 – 10 Panels (~4.4 kWp – 5.5 kWp Array) | 5 kWh Lithium Battery | R75,000 – R95,000 | Small home / Townhouse (300 – 400 kWh/month) |
| 8 kW Hybrid | 12 – 14 Panels (~6.6 kWp – 7.7 kWp Array) | 10 kWh Lithium Battery | R120,000 – R160,000 | Medium family household (500 – 700 kWh/month) |
| 12 kW Hybrid | 18 – 22 Panels (~9.9 kWp – 12.1 kWp Array) | 15 kWh+ Lithium Battery | R220,000 – R280,000 | Large estate / Heavy HVAC loads (800 – 1,000+ kWh/month) |
The Hybrid Advantage: Unlike strict off-grid systems (which require massive over-provisioning to survive consecutive days of poor weather) or grid-tied systems (which turn off entirely during load-shedding for grid safety), a hybrid system is optimal for South Africa. It prioritizes solar generation during the day, charges the battery bank for peak times or outages, and uses the municipal grid strictly as a supplemental fallback.
Calculating the Self-Consumption Ratio and Yield
A common industry misstep is assuming a solar system will automatically wipe out 100% of your electricity bill from day one. In reality, your savings are dictated by your Self-Consumption Ratio—the percentage of generated solar power that your home actually consumes directly or stores successfully in your batteries, rather than letting it go to waste.
Actual energy offset varies widely based on several real-world variables:
- Physical Constraints: Roof orientation (ideally North-facing in South Africa), pitch angles, and localized tree or structural shading.
- Environmental Factors: Seasonal winter irradiance reductions when daylight hours shrink.
- User Behavior: Matching heavy loads (like geysers, pool pumps, and washing machines) to peak midday generation hours rather than drawing heavily from batteries at night.
While a highly optimized household that shifts its consumption behavior to the daytime can offset 80% or more of its grid reliance, homes with heavy nighttime consumption profiles or unoptimized battery limits may realistic see an offset closer to 45% to 65%.
Mapping the Real Payback Window and Ongoing Costs
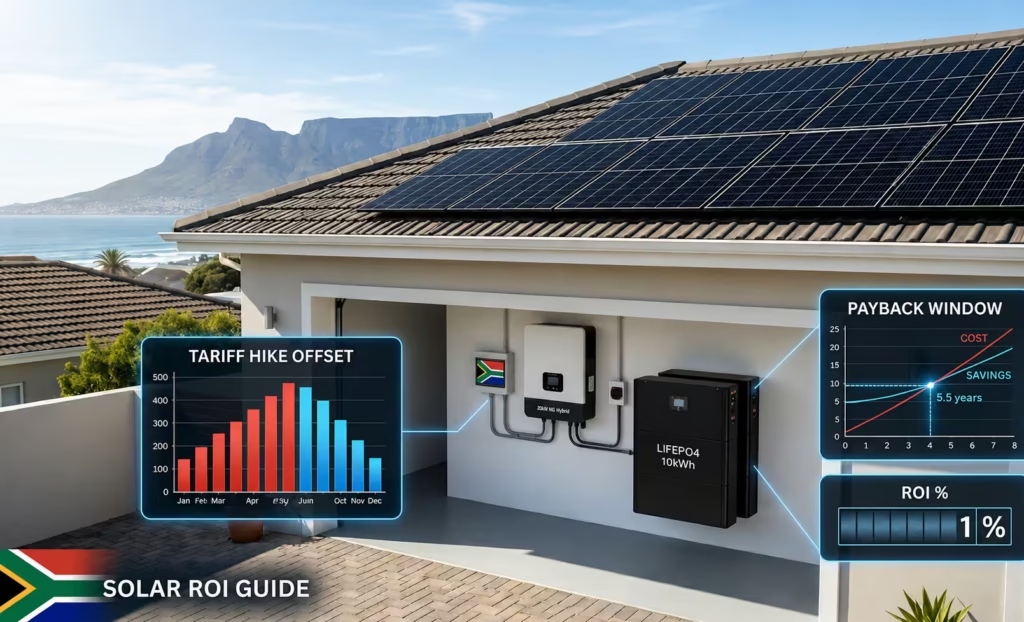
Let’s look at a realistic cash investment example for an optimized, medium-sized household installing a premium 8 kW system for R135,000, assuming an average monthly utility offset of R2,000:
Upfront Fixed Capital Outlay: R135,000
Realistic Year 1 Savings: R24,000
If electricity prices never changed, a simple break-even calculation would sit at roughly 5.6 years. When factoring in projected double-digit municipal tariff inflation hikes, the increased value of those avoided units shortens the projected payback window down to a highly achievable 4.5 to 6 years.
However, treating this timeline as a absolute “free energy” threshold ignores long-term system lifecycle maintenance:
1. Marginal Operational & Maintenance Costs (O&M)
Solar infrastructure is low-maintenance, but it is not maintenance-free. Panels require periodic cleaning to prevent dust buildup from degrading efficiency, and systems require compliance audits and electrical safety checks over time.
2. Component Degradation and Replacement Timelines
- Solar Panels: Carry an industry-standard 25-year linear performance warranty, typically guaranteeing the modules will still produce at least 80% to 85% of their original rated output at Year 25.
- Inverters: Central hybrid inverters typically carry a 5 to 10-year warranty. You must budget for at least one hardware replacement or major service refresh during a 20-year operational span.
- Lithium-Ion Batteries: Premium Lithium Iron Phosphate (LiFePO4) batteries are highly durable, often rated for 6,000+ cycles at an 80% Depth of Discharge (DoD). Under ideal operating temperatures ($25^\circ\text{C}$ or lower) and optimal cycle frequencies, they can reliably serve a home for 10 to 12+ years. However, operating them in harsh, unventilated spaces or continuously draining them to zero will accelerate chemical degradation, requiring earlier capital replacement.
The Bottom Line: A Balanced Financial Assessment
Investing in residential solar is fundamentally a capital expenditure that lowers your ongoing operational marginal costs. By paying for a substantial portion of your long-term energy needs upfront, you shield your household from the volatility of utility price hikes and grid instability.
While claims of “100% free power” ignore the realities of component aging, battery degradation, and fixed grid connection charges, the objective financial data remains compelling. When engineered accurately, sized realistically to your household profile, and treated as a managed asset with long-term maintenance expectations, a home solar system stands as a highly predictable, risk-mitigated investment that stabilizes a primary household expense for decades to come.